Last Updated on November 13, 2024 by admin
Google Analytics 4 has drastically changed the ability to pull data from your website performance and specifically your campaign performance. For years we were trained in the usability and conventions of the old UA Google Analytics. On July 1st, 2023 all Google Analytics accounts were required to transition to Google Analytics 4. Nearly all of the navigation tabs and legacy user conventions changed. Included in this was the ability to evaluate how your Google Ads campaigns were performing.
Users, especially those looking to measure revenue and return on ad spend, are forced to pull Google Ads data from around the GA4 platform vs the old way of it being one place. Now – there are a few different ways to quickly find short cuts to look at your Google Ads performance, here a few:
Basic Paid Search Data
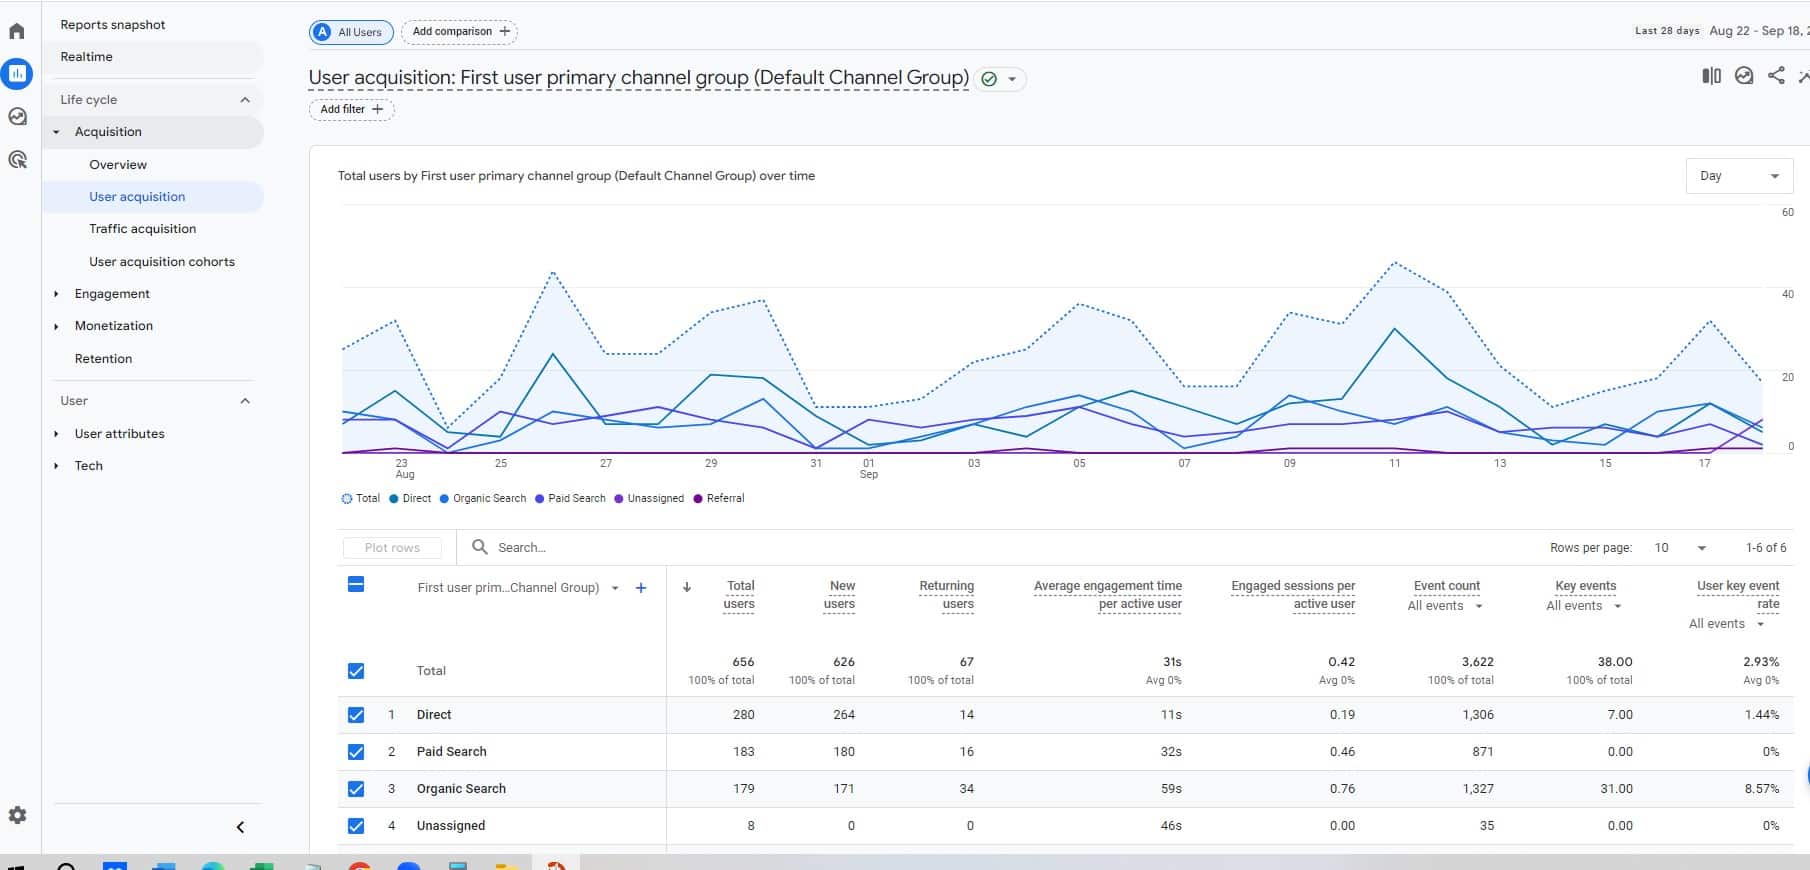
To look at your overall paid search data – you can use the left-hand navigational bar to click on the Reports>User Acquisition link.
More specifically – to drill into your Google Ads data, there are a few different paths. The easy one is to go Reports>Acqusition Overview. From there you will see several cards, including your Google Ads campaigns.
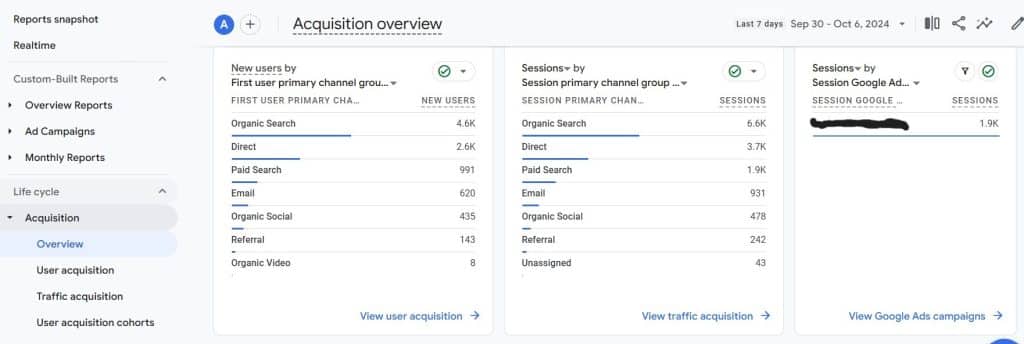
From there – click on the View Google Ads campaign to see your campaign details. On this screen – you can see how your users performing with Engaged sessions, average engagement time per session as well as a breakdown of our this channel of traffic is achieving Key Events. Key events typically are set by you and will involve key action points such as contact form submissions or purchases.

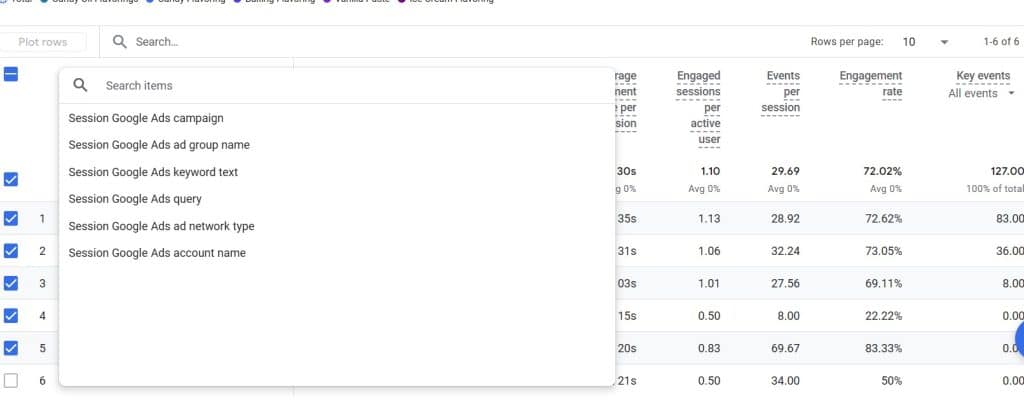
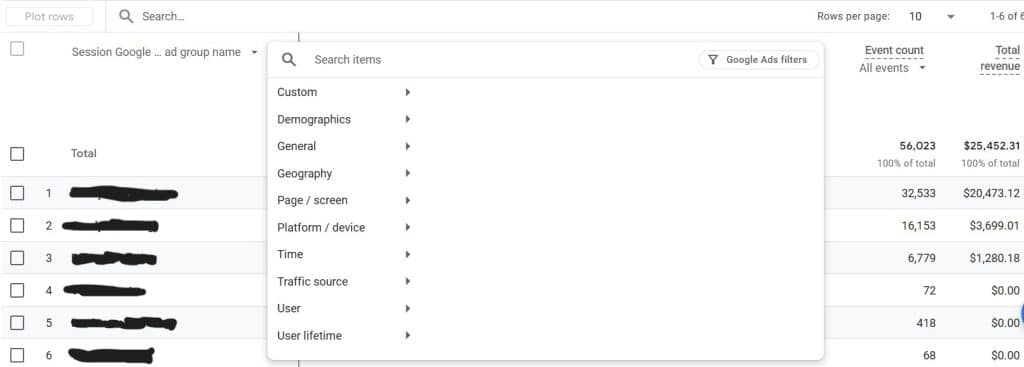
Now – this obviously just gives us broad view of how the campaigns are doing. You likely will want more detailed view of how ad groups and keywords are specifically performing so that you can best test and maximize your campaign performance. To do this – click on the small carrot to the right of the Session Google Ads campaign text at the top of the table. This will then generate a series of options to drill down into your performance data.
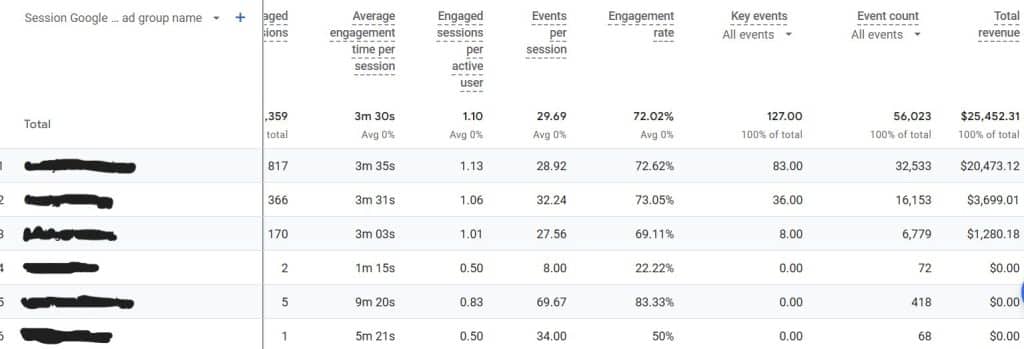
If you are measuring revenue with your campaigns via e-commerce you will need to scroll horizontally to the right to see the performance per ad group or keyword.
Finally – if you would like to do a further breakdown of campaign performance at the campaign, ad group or keyword level click the plus sign to the right of the carrot drop down in the upper left hand corner of the table. Doing so will allow you to select a variety of options to add in another data layer, including demographics (if enabled) or geography. I personally like to use the device option to evaluate this to see how our Google Ads users are performing in mobile vs desktop vs tablet.
If you are running a Google Ads campaign in a e-commerce environment, you can do a further analysis on your direct Return on Ad Spend. To do this, you do need to go to a separate module. Using the left hand vertical navigation you will see the options of Reports, Explore and Advertising. Select Advertising and choose Planning> Google Ads. (this is also the bullseye looking icon) Here you can see the breakdown of your Google Ads cost, cost per click, revenue and return on ad spend. You can also use the carrot and plus options to further add data layers to evaluate your campaign performance.

While there are several other pathways in GA4 to look at your Google Ads performance – these are generally the most straightforward and basic ways to evaluate how you are spending your money with Google. Additionally – this data an be exported into excel or pdf as well as setup as dashboards in your home screen. Subjectively, this is far more complicated structure than the previous Google Analytics platform and I have anecdotally heard from many marketing managers that they are struggling to use GA4. Hopefully, this post gave you some basic shortcuts to quickly pull your data.

Leave a Reply