Last Updated on January 25, 2018 by admin
Google Analytics is an incredibly useful and powerful platform. Yet so many organizations we work with, from Fortune 500 publicly traded companies to small, nine-room bed and breakfasts, struggle with using it to help understand their website and business. Common complaints and questions we hear from CMOs and business owners include:
Where do I start?
There is too much to go through.
How do I see just a certain kind of traffic?
What key area should I really focus on?
I just want to see if traffic is up or down.
Where do I go to see if our campaigns are working?
While Google Analytics is overwhelming at the start, taking some time to get to know the interface can pay off in the long run.
When trying to learn Google Analytics, I recommend taking advantage of the robust support section, as well as several forums. It is also beneficial to continually play with the data and numbers for your site in Google Analytics. However, it can be difficult to do if your site just added the Analytics tracking code, or doesn’t have enough traffic to get good sample numbers. However, Google has graciously opened up the data behind its merchandise store and allowed users to see and play with its data. The account is available at https://analytics.google.com/analytics/web/demoAccount. Note, you will have to have a current Google account to gain access. You can add it to your current profile, or create a new analytics account with this demo.
Once you’re in, you have a tremendous data set available to crunch numbers and run simulations. Here are a few data points I recommend looking at to get started.
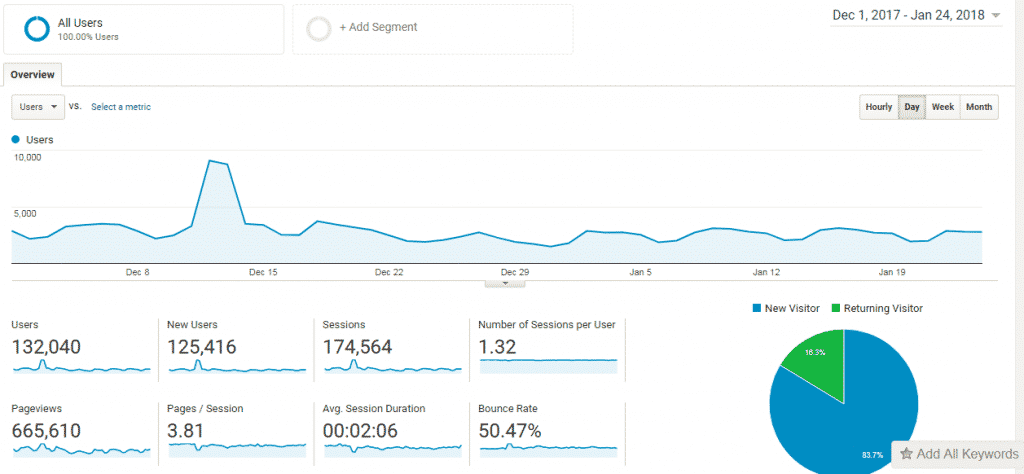
Audience Overview
The audience overview is where most users will get started. It shows all the traffic that has come to your site, how long users are spending on the site, and more.
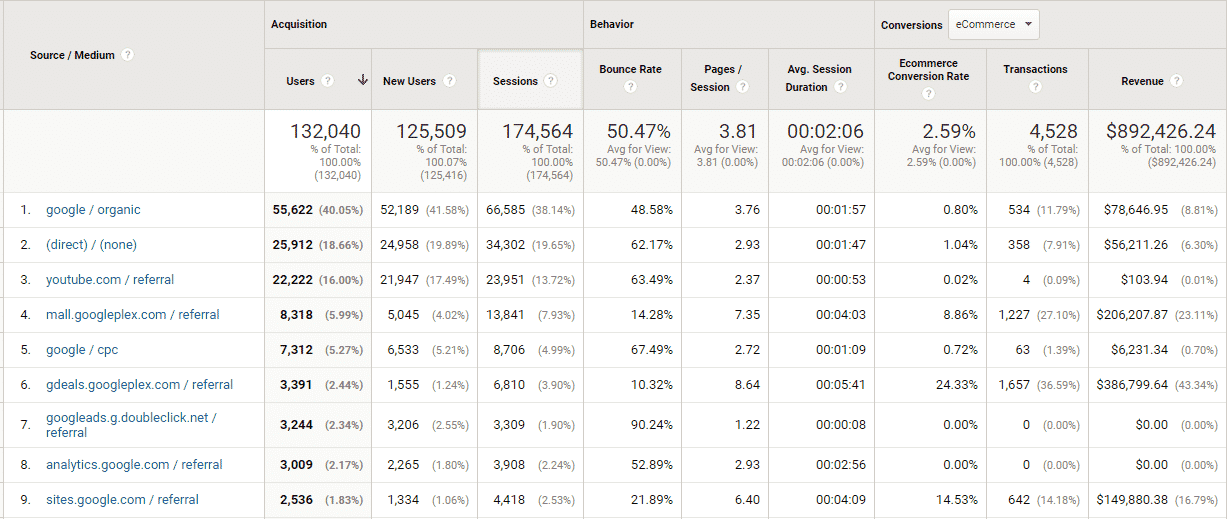
Source/Medium
View how traffic arrived at the Google Merchandise store, including data for campaigns the Merchandise store has run. If you’re unsure what the source and medium are, check out the definition in our SEO glossary.
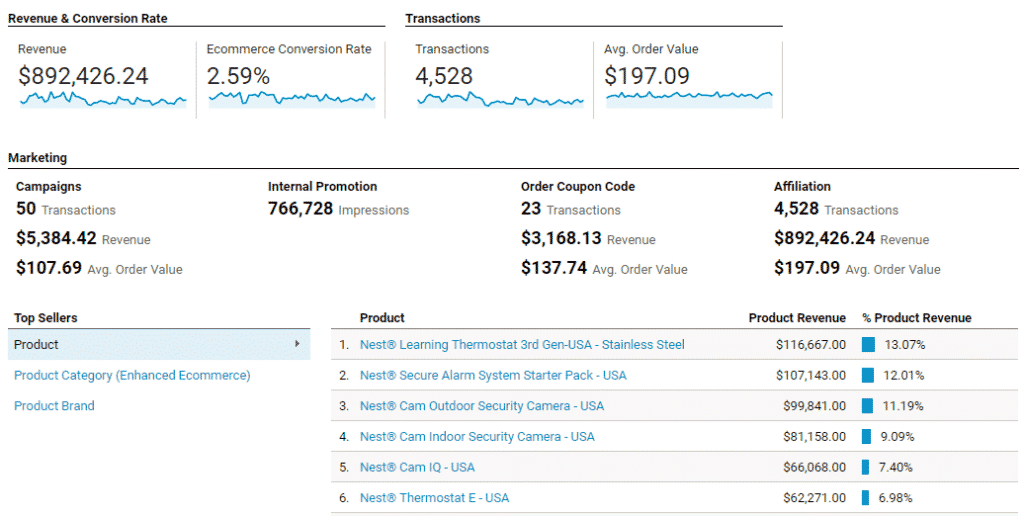
Revenue
Google is completely transparent and opens up its revenue numbers in the e-commerce section. Once you understand how revenue is tracked in Google Analytics, you can look at your website’s data to learn about how your user’s shop.
Segments
Another important teaching component of the demo account is the ability to play with segments. There are default segments in Google Analytics to work with, as well as the ability to create custom segments. It’s easier to get comfortable with segments when using a large sample data set. For example, if you are trying to learn how to track the visitor behavior patterns of purchasers, you have a good framework to work on in this demo account:
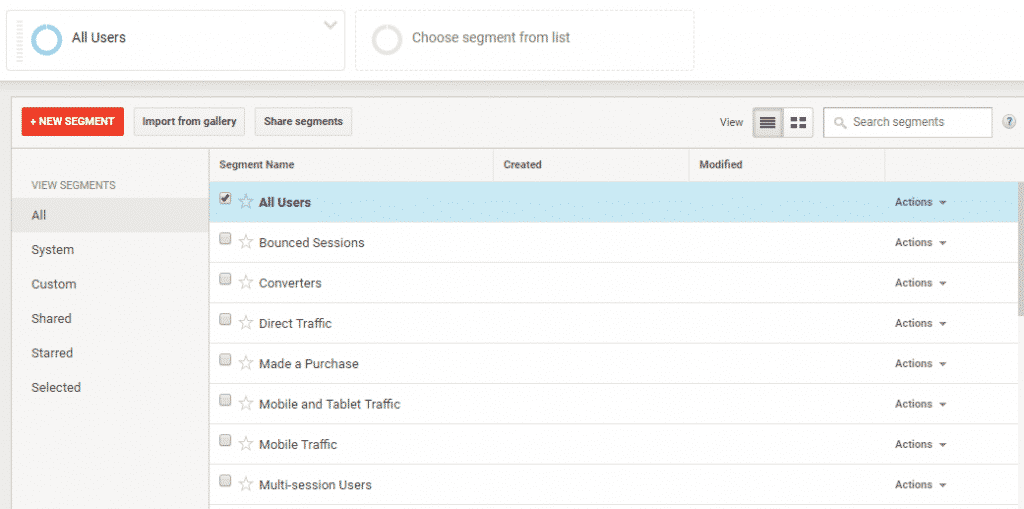
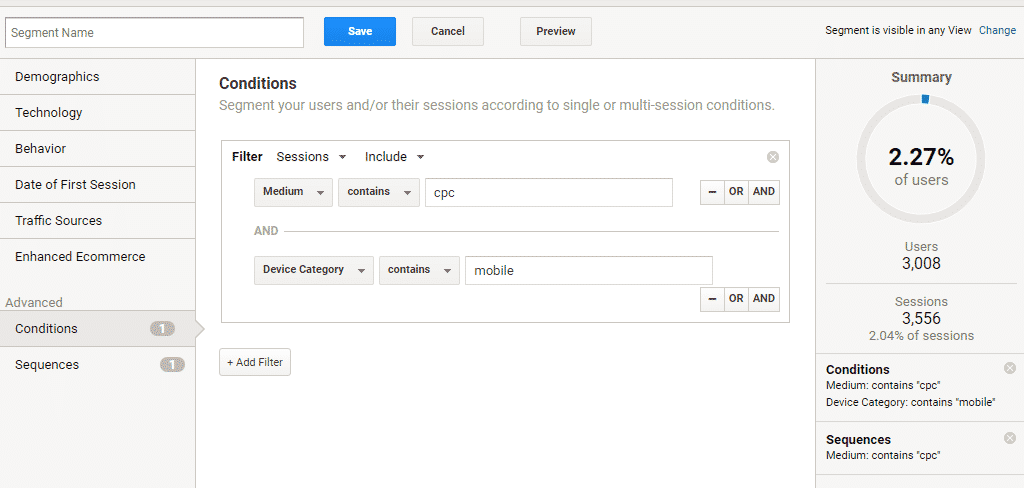
Like any account, the demo account allows you to use the basic segment templates featured above, and you can also create custom segments. For example, try creating a segment showing those that came from a PPC campaign and were on a mobile device.
Concluding, the demo account can be a great tool to use in order to get familiar with Google Analytics using large amounts of sample data. Additionally, it can be a good teaching module for a new employee or an intern before letting them loose into your own account. Give it a look.

Leave a Reply