Last Updated on January 30, 2020 by Mike

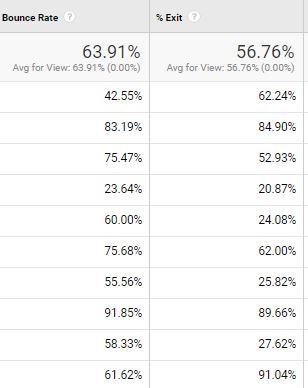
When poking around Google Analytics, you may have found side by side statistics bounce rate and exit rate (also known as % exit in Google Analytics). Those sound like the same thing though, right? So why are you seeing different percentages for the same page?
What’s the Difference?
The key here is the difference in how bounce rates and exit rates are calculated, and what is considered an exit versus a bounce. Here is a brief summary of exit rates and bounce rates via Google:
- For all pageviews to the page, the exit rate is the percentage that were the last in the session.
- For all sessions that start with the page, bounce rate is the percentage that were the only one of the session.
- Bounce rate for a page is based only on sessions that start with that page.
So what does that all mean? A few things to keep in mind when thinking about bounces versus exits:
- A bounce is only recorded for one and done visits. The visitor lands on a webpage and exits before clicking through to another page.
- An exit will always be recorded for a visit. The exit page is the last page a person is on before leaving the website.
- All bounces are exits, but not all exits are bounces.
To better help you wrap your head around how Google calculates exit rates and bounce rates, here are a few simple examples:
Example 1
Your website has page A, B and C and your website received one session per day over a three day period with the following order of pageviews:
- Day 1: Page C > Page B > Page A > Exit
- Day 2: Page A > Page C > Page B > Exit
- Day 3: Page C > Exit
Exit Rates
- Page A – 50%
- Page B – 50%
- Page C – 33%
Page A had a total of 2 pageviews and 1 of them led to an exit, so its exit rate is 50%. The same goes for Page B: 2 pageviews, 1 led to an exit, exit rate of 50%. Page C had 3 pageviews and 1 of them led to an exit, so its exit rate is 33%.
Bounce Rates
- Page A – 0%
- Page B – 0%
- Page C – 50%
Page A initiated a session on day 2, however that session led to other pageviews. Page B never initiated a session.
Page C had three pageviews, so you may think that its bounce rate should be 33%. However, the pageview on day 2 does not count towards calculating the page’s bounce rate because Page A initiated the session on that day. Remember: “Bounce Rate for a page is based only on sessions that start with that page.”
Example 2
Let’s look at a slightly more complicated example, using the same pages but expanding the number of sessions.
- Day 1: Page C > Page B > Page A > Exit
- Day 2: Page C > Exit
- Day 3: Page B > Page A > Page C > Exit
- Day 4: Page A > Exit
- Day 5: Page C > Page A > Page B > Exit
Exit Rates
- Page A – 50%
- Page B – 33%
- Page C – 50%
4 of the 5 sessions included Page A and in two of the sessions Page A was the exit page, so an exit rate of 50%. 3 of the 5 sessions included Page B and in 1 of the sessions Page B was the exit page, so an exit rate of 33%. 4 of the 5 sessions included Page C and in two of the sessions Page C was the exit page, so an exit rate of 50%.
Bounce Rates
- Page A – 100%
- Page B – 0%
- Page C – 33%
When calculating bounce rates for specific pages, we’re only considering sessions that started with a specific page. For Page A one session began with Page A (Day 4) and that led to an exit. Therefore it has a bounce rate of 100%. One session started with Page B, but it resulted in a multiple page session, so it had a bounce rate of 0%. Three sessions started with Page C, and one of those three sessions was a single-page session. So it had a bounce rate of 33%.
How to Read the Data
Now that you know the difference between a bounce rate and an exit rate, how do you use the data in practical terms? How do you better understand the user behavior of your website visitors, and make more informed decisions when making changes to your website using bounce rate and exit rate data?
First off, there are a large number of factors that can influence both bounce rates and exit rates. For that reason, it’s easier to pinpoint factors and try out new ideas when you compare bounce rates to different date ranges.
You may have undergone a website redesign within the past year, or traffic from paid search may have grown substantially since that time. In general, being able to compare apples to apples date ranges can help you better evaluate user behavior for your website.
Exit Rates

Exit rates vary wildly based on page type. For example, a contact page that lists out your phone number and contact is quite often the final page your website visitors will visit before exiting. Having high exit rates on your conversion pages is typically not a bad thing at all.
Concern should be raised where you see similar pages with wildly varying exit rate percentages, or you see significant changes in exit rate percentages over a period of time.
For example, if service page A has an exit rate of 50% and service page B has an exit rate of 90%, you’ll want to do some investigating. Are the pages structured differently? Are there different call-to-actions on each page? Does one page have a different makeup of traffic sources?
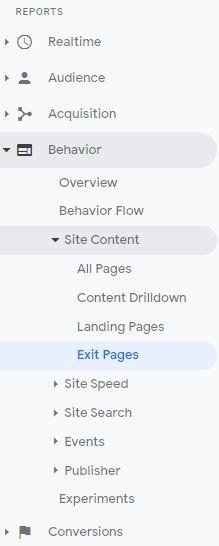
To find a detailed report on exits, pageviews, and exit rate, go to Behavior > Site Content > Exit Pages in Google Analytics.
Bounce Rates
Similar to exit rates, you may see very different bounce rates for each of your page types. Transition pages, like your home page or your main product or services page, are set up to help guide users towards other content on your website. You should expect to see lower bounce rates for these pages.
On the other hand, blog posts are set up to address very specific topics and cover all the information that a visitor needs. These pages often have high time on-site metrics, but high bounce rates.
Traffic sources can heavily influence bounce rate percentages as well. For example, if you include one service page in your paid search marketing campaigns but not another, the pages will likely have a different breakdown in their traffic sources and will likely have different user experience metrics.
Again, causes for concern with bounce rates involve big changes over time or similar pages with varying bounce rates. You should also prioritize pages that you expect to have lower bounce rates. You can certainly focus on ways to lower bounce rates for blog post pages, but keep in mind that these pages will naturally have higher than average bounce rates.
Photo Attribution:
Photo by Carlos Muza on Unsplash

Leave a Reply