Last Updated on December 16, 2021 by admin
You write and write and write and sometimes the content hits and sometimes it doesn’t. If you’re like many online marketers and content creators, you may not have the bandwidth to obsessively track the progress of all of your content. However, if you’re like me, you probably can find time to periodically go back and review what’s working and what isn’t. In many cases, you’ll find content that you spent a good bit of time on that isn’t doing shit.
That’s depressing. But, underperforming blog posts or product pages may lend themselves to some excellent long-tail keyword opportunities if you have the know-how to do so. With a little magic, you can combine the data from Google Search Console with Google Data Studio and then work some excel shenanigans and find some ripe opportunities.
Tool Time…and a Hat Tip.
First thing’s first, I’ve got to give a hat tip to the folks at Uproer for turning me on to Data Studio with their informative guide How to See the Ranking URL for Your Keywords in Search Console. That tutorial is invaluable for maximizing your Search Console data. They show you how to combine the page and query data so you can see which queries are generating impressions for specific pages – and you can also pull in the impressions, clicks, CTR, and rankings data. If you like the reports you can pull from SEMrush and Ahrefs – just imagine them with Google’s data for your site, because that’s what you’re getting here. I’ll run you through an example using Netvantage’s own site.
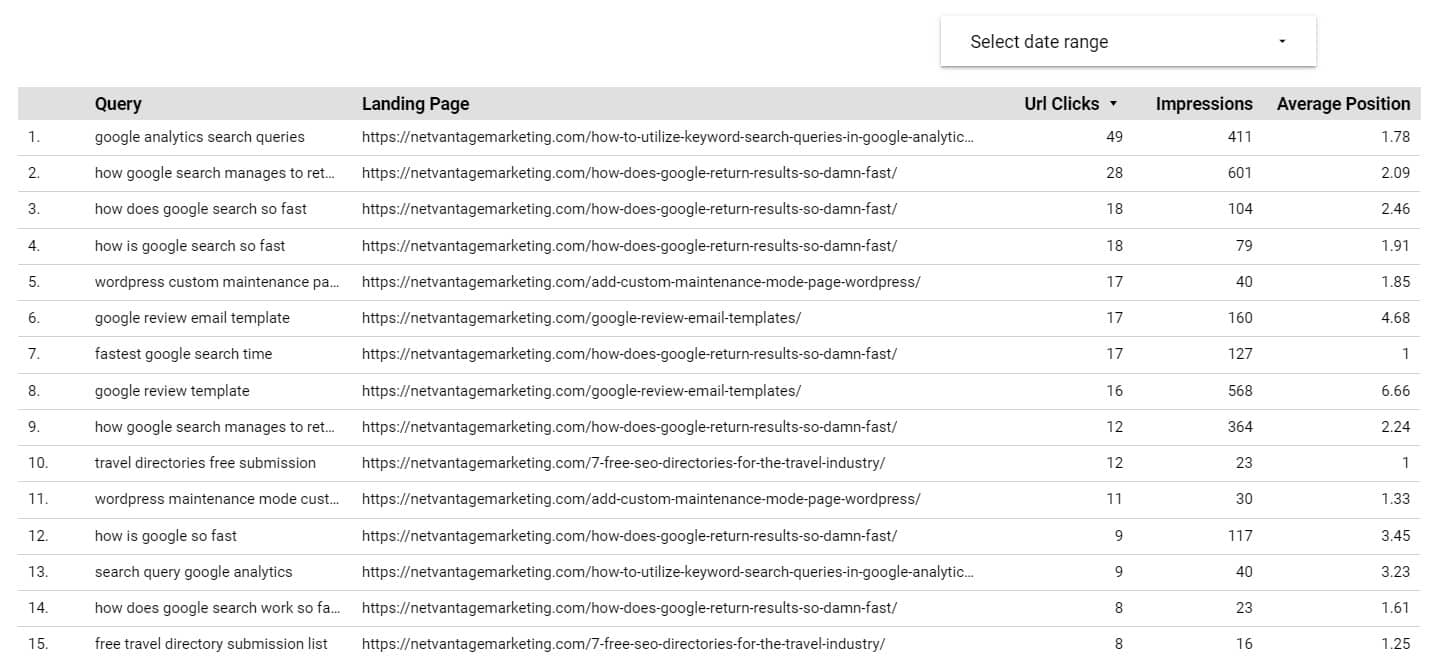
If you follow the Uproer guide, you’ll end up with a Google Data Studio report that looks something like this.
Pretty cool, right? Well, we’re just getting started. What I want to find out here is, which pages on our site are generating impressions, but not clicks.
“But you can do that in Search Console!”
That’s true, but now we can easily see which keywords are generating those impressions, and where the site’s been ranking for those keywords. Better yet, with a pivot table, we can see how many different keywords are generating those impressions. So, as we work through this we can gauge the best opportunities by the number of potential long-tail keywords as well as the volume of impressions those keywords are generating.
Let’s Make this Movie Happen
Once you’ve got your Data Studio report, you need to pick a date range and then export it to Excel. Then, follow these steps:
- Select all the data in your sheet and add that data to a pivot table
- Add the landing page into rows field
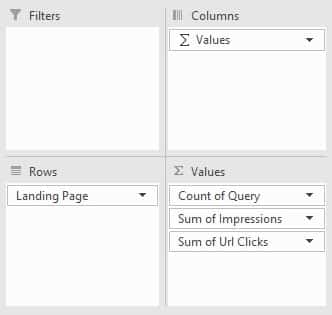
- Add query, url clicks, and impressions into the values field – it should look like this

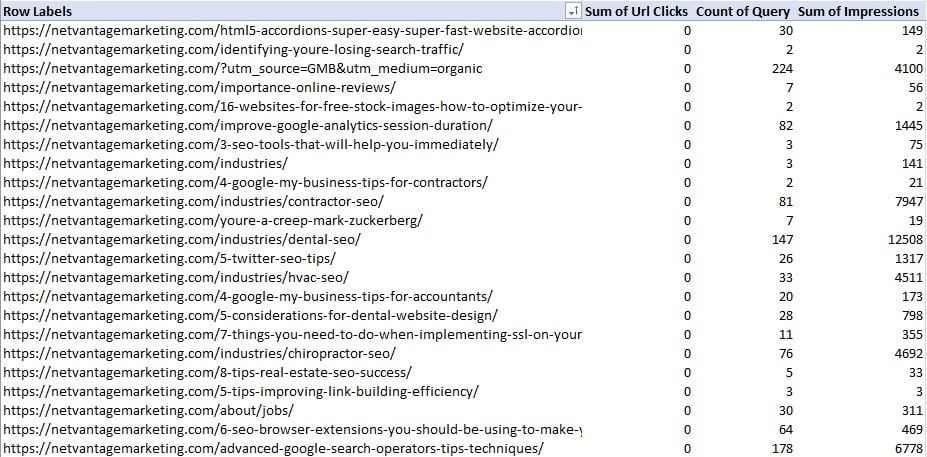
- This should give you a pretty sweet pivot table, that shows you the total URL clicks, the number of queries that URL is ranking for, and the total number of impressions that URL generated. Now, sort the queries highest to lowest, impressions highest to lowest, and then the URL clicks lowest to highest. You’ll get something like this.

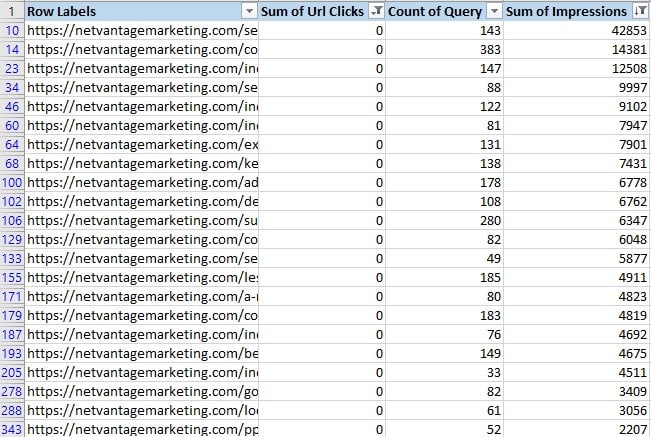
- At this point, I like to copy and paste this data into another tab on my sheet so I can play with it some more – basically setting minimum filters for the number of queries and impressions you want to show in your results. You can also set your limit on the threshold of clicks a page is getting – in our case, sadly, we’ve got a lot of them getting zero clicks. Yikes! But again, these numbers are full of opportunity. Hell, we’ve got several pages here generating thousands of impressions per month with no clicks. Once you tinker with your filters you can start plucking out the best opportunities to review. My spreadsheet looked a little something like this – sorted by pages with the highest impressions – and no clicks.

- Now, here’s the fun part. You can go back into your initial tab, the one you downloaded from Data Studio, and filter the URLs from the table above to start plucking your keyword opportunities. The top page for us is our dental SEO page, which racked up over 12,000 impressions from 147 queries in the past month. Another is our white label SEO services for agencies page, which racked up a staggering 42,853 impressions! If I filter out the keywords and trim out those that are say, ranked higher than 35th, we get a pretty actionable table of keywords we can better optimize that page for, and hopefully, start reeling in some of that traffic. Check it out.

At this point, you can go back to the ol’ SEO playbook by reviewing the on-site SEO for your pages, adjusting your internal linking strategy, etc. Ultimately, though, you’ll have a game plan to start turning some of these underperformers into producers.

Leave a Reply